Dashboard Truth and Pump Reality: Reconciling Van Economy Before It Costs You
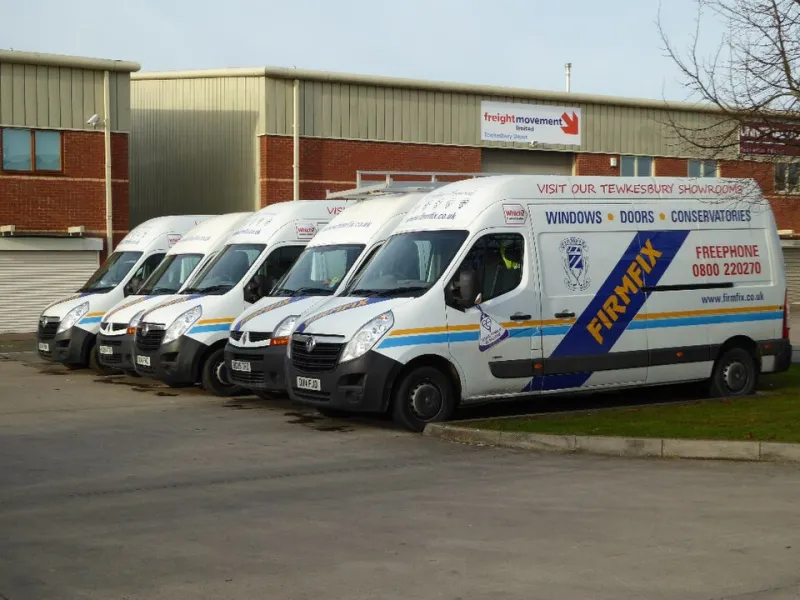
Photo: Martin Pettitt from Bury St Edmunds, UK, CC BY 2.0, via Wikimedia Commons
A fleet manager can be forgiven for treating the dashboard as the truth. The trip computer is immediate, the telematics portal is tidy, and both appear to speak the same language as the fuel card. In practice, they measure different things. The dashboard estimates consumption from engine data; the fuel card records purchases; the pump records litres delivered. When those three are allowed to drift apart, cost-per-mile reporting quietly loses its footing.
The problem is not that one source is wrong. It is that each source answers a different question. A van’s trip computer may show 38mpg while the fuel-card arithmetic for the same month suggests 34mpg. Neither figure is necessarily false. One may include idling, another may exclude a tankered top-up, and a third may be based on GPS distance rather than the odometer. For UK fleets trying to control fuel spend, the useful discipline is not choosing a favourite number. It is reconciling them.
Why the figures part company
Dashboard economy is typically calculated by the engine control unit from injector pulse width and distance travelled. It is a reasonable estimate for driver feedback, but it is not an audited measure of fuel drawn from the pump. Telematics can improve the picture by adding engine hours, idling time and GPS distance, yet its fuel figures may be derived from CAN-bus data, a modelled algorithm, or a combination of the two. The fuel card, meanwhile, records litres purchased at a site, not litres burned on a route.
Several ordinary fleet practices widen the gap. Partial fills interrupt the fill-to-fill calculation. On-site tankering adds litres that never appear on a fuel card. A missed transaction or a mis-keyed odometer reading can distort a whole month. Temperature affects fuel volume slightly, and pump shut-off behaviour can vary with foam and fill rate. Route mix matters too: a week of urban deliveries with high idling will not produce the same economy as a week of motorway running, even with the same driver and van.
The largest single distortion is often idling. A van standing at a loading bay, warming a cab or waiting at a gate is burning litres while adding no miles. Some trip computers include that fuel in their economy calculation; some telematics reports treat it separately. If the litres are counted but the miles are not, displayed economy falls. If the idling litres are excluded from a telematics fuel estimate, the portal can look better than the pump. Neither outcome is helpful unless the fleet manager knows which convention is in use.
A pump-to-pump method that survives scrutiny
The most defensible method remains the full-tank, fill-to-fill calculation. It is old-fashioned, but it ties fuel-card litres to odometer miles and can be audited. The steps are straightforward:
- Start with a full tank at a known pump and record the odometer, date, litres and fuel-card transaction. Do not use the dashboard’s range estimate as a baseline.
- Run the vehicle on its normal duty cycle. At each subsequent fill, record the odometer and litres purchased. Keep partial fills in the record, but carry them forward until the next full fill.
- At the closing full fill, calculate miles travelled between the two full-fill odometer readings and litres used across the intervening purchases. Convert to imperial gallons for UK MPG: miles ÷ (litres ÷ 4.54609).
- Compare that pump-derived MPG with the dashboard trip figure and the telematics figure for the same interval. Record the variance as a percentage, not just a number.
- Recalculate cost per mile from fuel-card spend and reconciled miles. The dashboard can coach a driver; the pump-to-pump figure should inform the budget.
For a mixed fleet, it is rarely practical to run this exercise on every van every month. A rolling sample works well: select vehicles by route type, age, driver group and fuel-card provider, then reconcile a representative group over a full quarter. Use the monthly check to catch outliers, and reserve the full fill-to-fill audit for vehicles that keep appearing outside tolerance.
The variables that move the gap
Idling is the first variable to quantify. A light commercial van can consume somewhere in the region of 0.5 to 1.5 litres an hour while idling, depending on engine size, auxiliary load and ambient temperature. Across a depot with several vans waiting at gates or running refrigeration, that becomes a real line in the fuel ledger. Telematics idle hours should be reviewed alongside fuel-card litres, not instead of them.
Tankering and on-site storage are the second. If a depot dispenses from its own tank, those litres must be added to the fuel-card total before any MPG calculation. A van that fills twice a month on a card and once from the yard tank will look unusually efficient on card data alone. The same applies to ad-hoc purchases outside the card network, which should be captured through receipts or a reimbursement process.
Temperature, fill cut-off and route mix are smaller but persistent. Fuel expands and contracts with temperature, and pump shut-off can leave a tank less than completely full. Neither effect usually explains a large variance on its own, but both can nudge a monthly figure. Route mix and payload often explain more: a van that has moved from trunking to multi-drop work may show a genuine economy change that no amount of dashboard calibration will remove.
A 30-minute monthly check
The monthly check should be short enough to survive a busy operating week. Set aside half an hour and work from three exports: fuel-card transactions, telematics summary data and a simple driver or depot record of odometer readings. The aim is not to rebuild the entire ledger. It is to identify where the dashboard, telematics and pump disagree enough to matter.
Build a single sheet with one row per vehicle. Include registration, opening and closing odometer, fuel-card litres, on-site litres, telematics distance, telematics MPG, pump-derived MPG where available, variance percentage, idle hours and a short note on route mix. Filter for vehicles with complete data and flag any variance beyond an agreed tolerance, typically 5 per cent for a monthly check. Investigate the outliers before changing budgets or challenging drivers.
Finally, document the assumptions. Note which vehicles were on partial fills, which drew from the yard tank, and which telematics figures are modelled rather than measured. That record matters as much as the number itself. A reconciled fuel figure with clear caveats is more useful than a precise-looking dashboard figure with no audit trail. The dashboard is a coaching tool; the fuel card is a cash record; pump-to-pump reconciliation is the bridge between them.